

Image Details
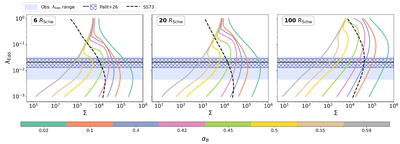
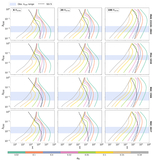
Caption: Figure 3.
Theoretical S-curves at the λEdd–Σ plane, at the literature black hole mass of Mkn 590 and at R = 6, 20, 100 RSchw, color-coded by αB. The shaded band marks the empirical CL transition Eddington ratios from A. Jana et al. (2025), and the cross-hatched strip those from B. Palit et al. (2026).The empirical thresholds intersect the theoretical knees only for αB ≈ 0.5–0.55 at the inner radii. Black dashed lines correspond to S-curves predicted from standard accretion theory prescribed with α = 0.1.
Other Images in This Article
Copyright and Terms & Conditions
© 2026. The Author(s). Published by the American Astronomical Society.

Copyright ©
2026 Astronomy Image Explorer. All Rights Reserved.
