

Image Details
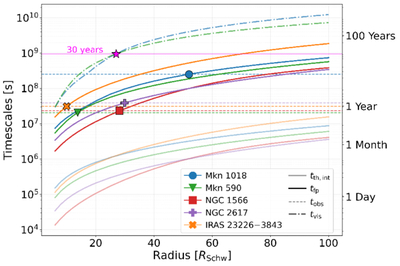
Caption: Figure 4.
Vertically integrated thermal timescales tth,int (faded lower curves), front propagation timescales tfp (solid upper curves), and viscous timescales tvis (dashed–dotted curves, shown for the two sources with repeating CL events, Mkn 590 and Mkn 1018), as a function of disk radius for the five CLAGN in our sample given by different colors and markers. Horizontal dashed lines mark the empirically observed transition duration, and the solid dots indicate the radius at which tfp matches tobs. The magenta horizontal line marks the ∼30 yr recurrence period of the repeating sources; the star indicates the radius, R ≈ 29 RSchw, at which tvis matches it.
Other Images in This Article
Copyright and Terms & Conditions
© 2026. The Author(s). Published by the American Astronomical Society.

