

Image Details
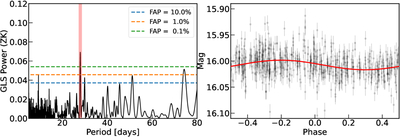
Caption: Figure C1.
Left panel: GLS periodogram of the ZTF light curve. The vertical red line represents the rotational period inferred for TOI-5628A. The FAP levels of 10%, 1%, and 0.1% are shown as horizontal dashed lines with different colors. Right panel: phase-folded ZTF light curve at 27.9 days with the best-fit sinusoidal model, shown as a red solid curve.
Other Images in This Article
Copyright and Terms & Conditions
© 2026. The Author(s). Published by the American Astronomical Society.

Copyright ©
2026 Astronomy Image Explorer. All Rights Reserved.
