

Image Details
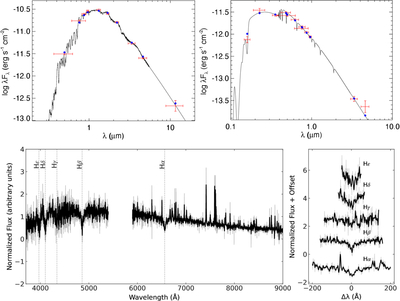
Caption: Figure B1.
SED of TOI-5628A (Top left) and the associated WD TOI-5628B (Top right). Red symbols represent the observed photometric measurements, where the horizontal bars represent the effective width of the passband. Blue dots are the model fluxes from the best-fit PHOENIX (left) and D. Koester 2010 (right) atmosphere models (black). Bottom left: The stitched blue (3700–5400 Å) and red (5900–9000 Å) Shane/Kast spectrum of TOI-5628B, normalized to an arbitrary continuum level. The raw spectrum is shown in gray, whereas a Gaussian-smoothed spectrum (σ = 1 Å) is plotted in black. Clear Balmer absorption features are marked with dashed vertical lines. Bottom right: normalized Balmer line profiles plotted as a function of Δλ from line center. Each line is vertically offset for clarity. These spectral features confirm the DA WD nature of TOI-5628B.
Other Images in This Article
Copyright and Terms & Conditions
© 2026. The Author(s). Published by the American Astronomical Society.

