

Image Details
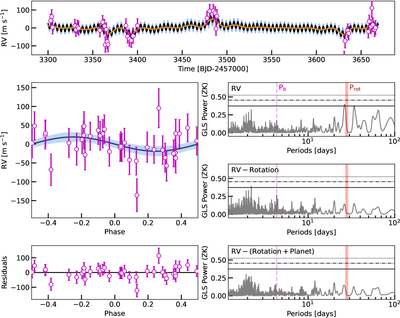
Caption: Figure 2.
Top panel: time series of SPIRou RVs of TOI-5628A along with the best-fit GP+Keplerian model. The orange curve represents the GP model. Middle left panel: phase-folded RVs after subtracting the best-fit GP model, along with the Keplerian model shown as a black curve. In both panels, the blue shaded region marks the uncertainty at the 68% credibility interval. Bottom left panel: residuals of the fit, in m s−1. The presented RV error bars are the quadratic sum of the measurement uncertainties and the instrument jitter. Right panels: GLS periodograms of the RVs (top), RVs after excluding the GP model (middle), and the residuals after subtracting the GP and Keplerian models (bottom). The orbital period of the planet and the stellar rotation period identified by the ZTF light curve are marked as vertical magenta and red lines. The FAP levels of 10%, 1%, and 0.1% are shown as horizontal solid, dotted–dashed, and dotted lines.
Other Images in This Article
Copyright and Terms & Conditions
© 2026. The Author(s). Published by the American Astronomical Society.

