

Image Details
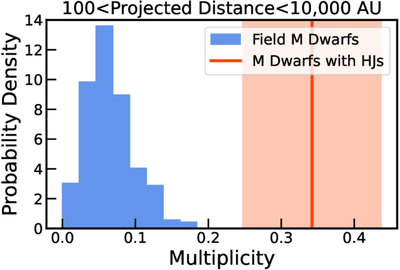
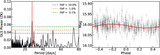
Caption: Figure 3.
Comparison of the stellar multiplicity of M dwarfs with hot Jupiters and field M stars at projected separations between 100 and 10,000 au. The multiplicity of the planet sample, P(Comp∣HJ) = 34.2% ± 9.5%, is indicated as a vertical red line with the shaded region marking the 1σ uncertainty. The multiplicity of field M dwarfs, P(Comp) = 5.3% ± 3.7%, is shown as a histogram based on the search for 1000 sets of randomly selected field M stars with properties matched to those of the planet sample.
Other Images in This Article
Copyright and Terms & Conditions
© 2026. The Author(s). Published by the American Astronomical Society.

Copyright ©
2026 Astronomy Image Explorer. All Rights Reserved.
