

Image Details
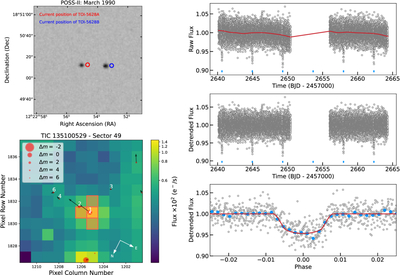
Caption: Figure 1.
Top left panel: POSS-II image of TOI-5628A and TOI-5628B obtained in 1990. The red and blue circles are the current positions of the two stars. Bottom left panel: TPF plot of TOI-5628A in Sector 49 with the photometric aperture overlaid as the orange shaded region. TOI-5628A is marked as a white cross. The black arrows represent the proper motions of every star. Right panel: raw (top), detrended (middle), and phase-folded (bottom) TESS light curve. The transits are highlighted with blue ticks. The blue dots are the light curve binned to 10 minutes. The red curve is the best-fit model from the joint analysis.
Other Images in This Article
Copyright and Terms & Conditions
© 2026. The Author(s). Published by the American Astronomical Society.

