

Image Details
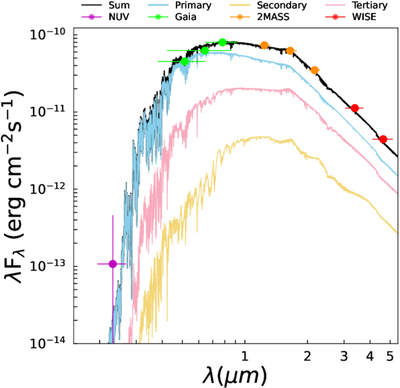
Caption: Figure 3.
SED fitting of G6096 from joint SED and dynamical results. The black line shows the best fit. The blue, yellow, and pink lines represent the theoretical spectra of the primary, secondary, and tertiary, respectively. The purple, green, orange, and red dots denote the observed magnitudes in the NUV, Gaia, 2MASS, and WISE bands, respectively.
Other Images in This Article
Copyright and Terms & Conditions
© 2026. The Author(s). Published by the American Astronomical Society.

Copyright ©
2026 Astronomy Image Explorer. All Rights Reserved.
