

Image Details
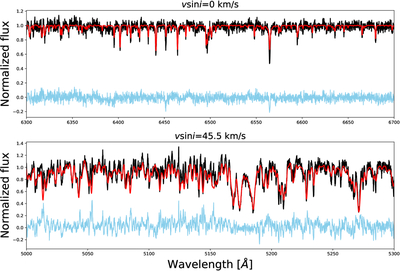
Caption: Figure B2.
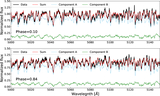
Comparison of the observed spectrum of G6096 with the best-fit template. The black line shows the observed MRS spectrum at maximum redshift, the red line represents the best-fit synthetic template, and the blue line indicates the residual spectrum.
Other Images in This Article
Copyright and Terms & Conditions
© 2026. The Author(s). Published by the American Astronomical Society.

Copyright ©
2026 Astronomy Image Explorer. All Rights Reserved.
