

Image Details
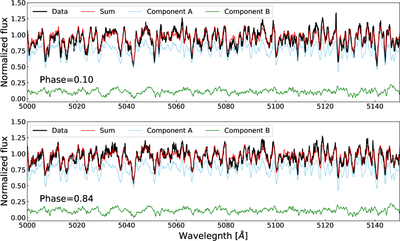
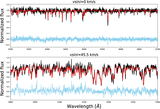
Caption: Figure 4.
Spectral disentangling results for q = 0.92 (=1.14/1.24) at phases of large redshift and blueshift. The blue lines mark the reconstructed spectra of the visible star, while the green lines represent the second component in each spectrum. The red lines are the sum of the two components, and the black lines represent the observed spectra.
Other Images in This Article
Copyright and Terms & Conditions
© 2026. The Author(s). Published by the American Astronomical Society.

Copyright ©
2026 Astronomy Image Explorer. All Rights Reserved.
