

Image Details
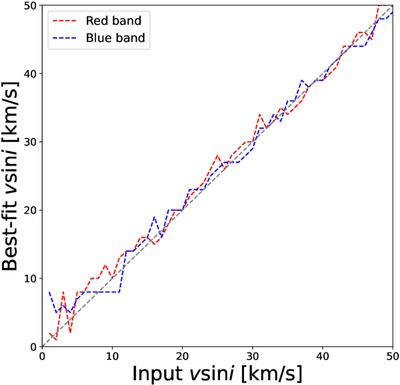
Caption: Figure B1.
Test results for the ﹩v{\rm{\sin }}i﹩ measurement. The red dashed line shows the ﹩v{\rm{\sin }}i﹩ values measured from the red band of the synthetic spectra, and the blue dashed line shows those from the blue band. The gray dashed line represents the 1:1 line.
Other Images in This Article
Copyright and Terms & Conditions
© 2026. The Author(s). Published by the American Astronomical Society.

Copyright ©
2026 Astronomy Image Explorer. All Rights Reserved.
