

Image Details
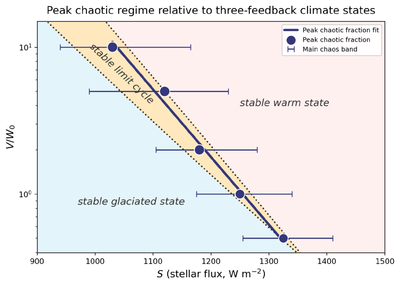
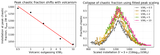
Caption: Figure 6.
Peak chaotic fraction in (S, V/W0) space for the four-feedback climate model compared to the behaviors predicted by the three-feedback model. Purple points show the stellar flux at which the chaotic fraction reaches its maximum for each normalized volcanic outgassing rate, while purple horizontal error bars indicate the main chaos band, defined as the range of stellar fluxes where the fraction of chaotic simulations exceeds half of its maximum value for that normalized outgassing rate. The solid line shows the best-fit relation for the peak location. Blue, orange, and red shaded regions show the stable climate regimes predicted by the corresponding three-feedback climate model (C. W. Arnscheidt & D. H. Rothman 2020) and are included for reference.
Other Images in This Article
Copyright and Terms & Conditions
© 2026. The Author(s). Published by the American Astronomical Society.

