

Image Details
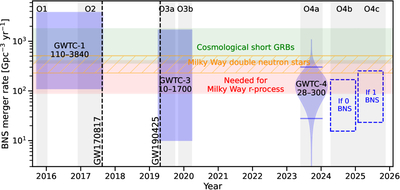
Caption: Figure 1.
Inferred BNS merger rate as a function of time, compared to the rates of SGRBs, MW DNS systems, and the rate required to explain the MW r-process mass. The GWTC-1 and GWTC-3 inferred rates show the union of 90% error bars over different posteriors (that assume different mass distributions), so we represent them as shaded blue rectangles. The GWTC-4 posterior inferred in this work is shown as a violin. The dashed, unfilled blue rectangles show the approximate 90% credible intervals on the BNS rate at the end of O4 if there are 0 new BNS or 1 new BNS detected in O4 once the data are fully analyzed.
Other Images in This Article
Copyright and Terms & Conditions
© 2026. The Author(s). Published by the American Astronomical Society.

Copyright ©
2026 Astronomy Image Explorer. All Rights Reserved.
