

Image Details
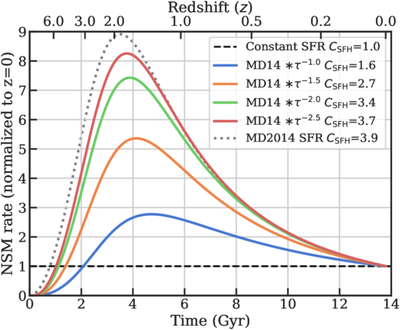
Caption: Figure 6.
NSM rates over time for different delay time distributions, normalized to the z = 0 rate. The dotted line shows the P. Madau & M. Dickinson (2014) star formation rate, while the dashed line shows a constant star formation rate. The colored lines show the P. Madau & M. Dickinson (2014) star formation rate convolved with different delay time distributions. More extended delay time distributions result in lower integrated numbers of NSMs, because the z = 0 rate is closer to the rate in the past. The legend shows CSFH for different delay time distributions and star formation histories, where CSFH is the enhancement in the number of NSMs relative to z = 0 due to the shape of the star formation history.
Other Images in This Article
Copyright and Terms & Conditions
© 2026. The Author(s). Published by the American Astronomical Society.

