

Image Details
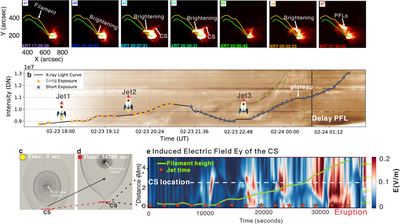
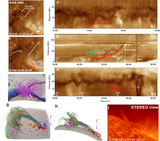
Caption: Figure 6.
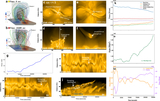
Panels (a1)–(a7) present Hinode/XRT soft X-ray images (Al-poly filter). Panel (b) shows the soft X-ray light curve integrated over the FOV of (a1)–(a7); the yellow and blue stars indicate the two exposure modes of XRT (long and short, respectively). Panels (c) and (d) display the 2D magnetic field lines in the central x–z cross section from the simulation. Panel (e) shows the electric field Ey along the CS during the filament eruption; the red stars mark the timing of the jets in the simulation, and the filament height is derived from the center of the simulated flux rope.
Other Images in This Article
Copyright and Terms & Conditions
© 2026. The Author(s). Published by the American Astronomical Society.

Copyright ©
2026 Astronomy Image Explorer. All Rights Reserved.
