

Image Details
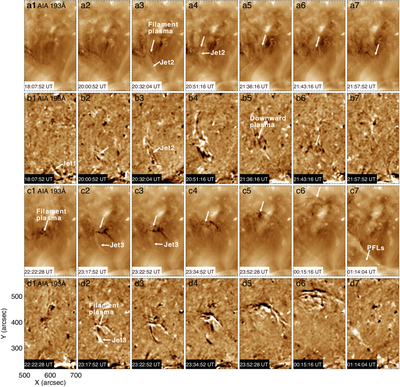
Caption: Figure 3.
Temporal evolution of the filament eruption driven by jet activity. (a1)–(a6) and (c1)–(c6) AIA 193 Å base-ratio images, capturing the jet activity, filament oscillations, and the formation of PFLs during the sequence. (b1)–(b6) and (d1)–(d6) Corresponding running-difference images in the AIA 193 Å passband, highlighting filament changes and propagating disturbances.
Other Images in This Article
Copyright and Terms & Conditions
© 2026. The Author(s). Published by the American Astronomical Society.

Copyright ©
2026 Astronomy Image Explorer. All Rights Reserved.
