

Image Details
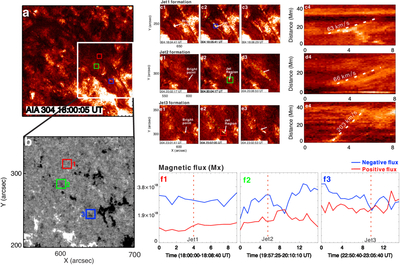
Caption: Figure 2.
Triggering process and magnetic evolution for the jet events. (a) Filament observed in the 304 Å channel. (b) Simultaneous magnetogram of the same region from HMI. (c)–(e) Time sequences of AIA 304 Å images of the jet triggering process, with panels (c4), (d4), and (e4) displaying the respective time–distance diagrams for each jet. (f1)–(f3) Time evolution of magnetic flux within the colored boxes in panel (b) (same color label indicates corresponding boxes), as derived from HMI line-of-sight magnetograms; the red and blue curves represent the positive and negative magnetic fluxes, respectively. (An animated version of this figure is available; the animation lasts 5 s and presents the triggering process of successive jets in the AIA 171 and 304 Å observations, with the FOV consistent with panels (c1), (d1), and (e1). It provides a dynamic view of the jet evolution and the magnetic reconnection.)
(An animation of this figure is available in the online article.)
(An animation of this figure is available.)
The video/animation of this figure is available in the online journal.
Other Images in This Article
Copyright and Terms & Conditions
© 2026. The Author(s). Published by the American Astronomical Society.

