

Image Details
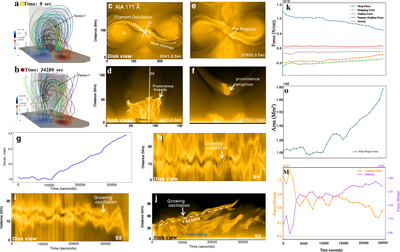
Caption: Figure 5.
MHD simulation results for the erupting oscillatory filament, including the height–time profile, growing transverse oscillations, decay index evolution, and kinematic/force analysis of the flux rope. Panels (a) and (b) show the magnetic flux rope in its stable and eruptive configurations, respectively. Panels (c)–(f) present synthetic AIA 171 Å images of the filament/prominence from two viewing angles, illustrating both the stable and eruptive phases. Panel (g) displays the evolution of the decay index of the background field as the filament ascends. Panels (h) and (i) show time–slice diagrams along the white lines S4 and S5 in panel (c), respectively. Panel (j) presents the time–slice diagram along the white line S5 in panel (d). Panel (k) shows the forces derived from the MHD simulation, including the Lorentz force components (hoop, strapping, and tension forces), gravity, and the plasma pressure gradient force. Panel (o) shows the temporal evolution of the flux rope cross-sectional area during the eruption. Panel (m) provides the time profiles of the Lorentz force and gravity acting on the flux rope. (A 12 s animated version of this figure is available. The animation presents the full time evolution of the simulated oscillatory filament eruption, including synthetic 171 Å images from both disk and limb views and the magnetic field lines of the flux rope in 2D and 3D perspectives, as well as the transverse and longitudinal filament oscillations, mass drainage, intermittent reconnection, and the eventual eruption.)
(An animation of this figure is available in the online article.)
(An animation of this figure is available.)
The video/animation of this figure is available in the online journal.
Other Images in This Article
Copyright and Terms & Conditions
© 2026. The Author(s). Published by the American Astronomical Society.

