

Image Details
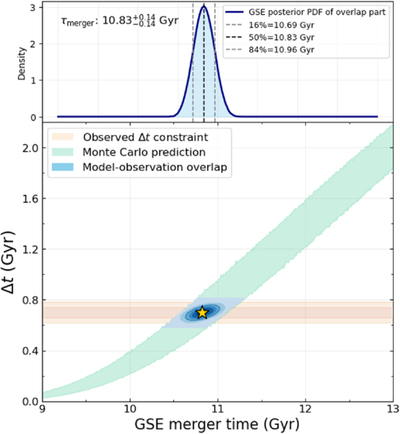
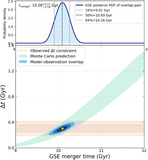
Caption: Figure B1.
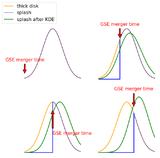
Constraint on the epoch of the GSE merger derived from the classical Splash and thick-disk selection. The green band shows the 2σ Δt–tGSE relation predicted by the Monte Carlo simulations, and the orange band indicates the 2σ observational constraint on the peak offset, ﹩{\rm{\Delta }}t=0.7{0}_{-0.04}^{+0.04}﹩ Gyr. Blue contours represent the model–observation overlap density, and the star marks the maximum-likelihood solution. The upper panel shows the marginalized probability distribution of the inferred merger epoch, yielding ﹩{t}_{{\rm{merger}}}=10.8{3}_{-0.14}^{+0.14}﹩ Gyr.
Other Images in This Article
Copyright and Terms & Conditions
© 2026. The Author(s). Published by the American Astronomical Society.

Copyright ©
2026 Astronomy Image Explorer. All Rights Reserved.
