

Image Details
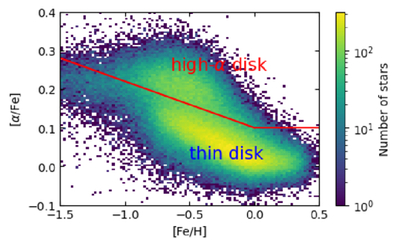
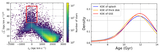
Caption: Figure 1.
[α/Fe]–[Fe/H] diagram for the adopted subgiant sample, showing a significant bimodality, with the low-α thin-disk and high-α thick-disk sequences. High-α sequence stars were then selected using [α/Fe] > −0.12 × [Fe/H] + 0.1, [α/Fe] > 0, and [Fe/H] > −1.5 (red lines). Stars below the red lines are dominated by the traditional thin-disk population (J. Imig et al. 2023).
Other Images in This Article
Copyright and Terms & Conditions
© 2026. The Author(s). Published by the American Astronomical Society.

Copyright ©
2026 Astronomy Image Explorer. All Rights Reserved.
