

Image Details
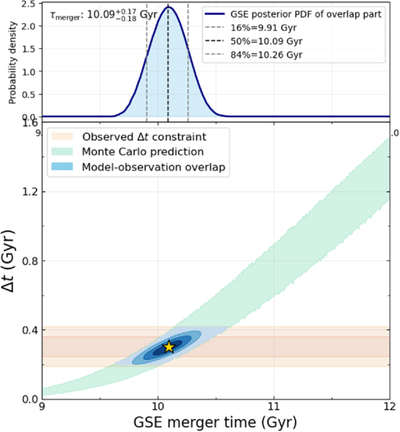
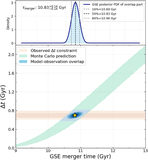
Caption: Figure 5.
Joint constraint on the GSE merger epoch from the observed peak offset. The green band shows the 2σ Δt–tGSE relation from Monte Carlo simulations, while the orange band indicates the 2σ observational constraint on Δt. Their intersection defines the region consistent with the data (blue contours), with the star marking the maximum-likelihood solution. The upper panel shows the posterior distribution of the merger epoch.
Other Images in This Article
Copyright and Terms & Conditions
© 2026. The Author(s). Published by the American Astronomical Society.

Copyright ©
2026 Astronomy Image Explorer. All Rights Reserved.
