

Image Details
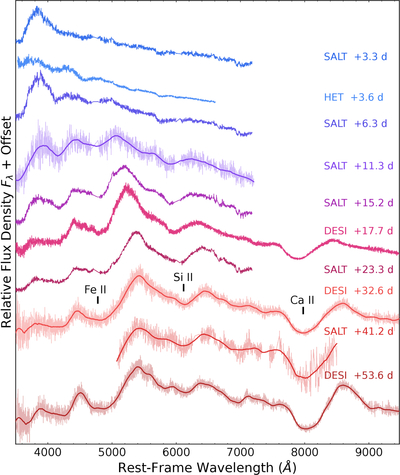
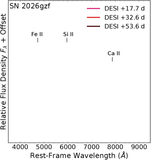
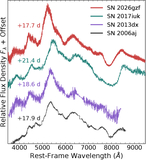
Caption: Figure 6.
Spectral sequence of EP260321a/SN 2026gzf obtained with SALT, HET, and DESI between 3.3 and 53.6 days after the EP trigger. Blueshifted absorption features of Fe II, Si II, and Ca II that are used for our analysis in Sections 3.2.1 and 3.2.2 are marked for clarity. Emission lines have been clipped from the spectra for clarity. Some spectra are smoothed with a Savitzky–Golay filter (thick lines) for visualization purposes, and the unsmoothed spectra (thin lines) are also shown for completeness. The spectral shape of the SALT data obtained prior to 10 days is uncertain below 4200 Å.
Other Images in This Article
Show More
Copyright and Terms & Conditions
© 2026. The Author(s). Published by the American Astronomical Society.

Copyright ©
2026 Astronomy Image Explorer. All Rights Reserved.
