

Image Details
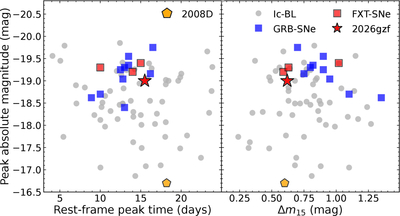
Caption: Figure 4.
A comparison of EP260321a/SN 2026gzf to other SNe Ic-BL, both associated with GRBs and identified independently through optical surveys. The left panel shows the peak absolute magnitude vs. the rest-frame peak time, and the right panel shows the absolute magnitude vs. Δm15, which represents the fade rate over 15 days relative to the peak time. GRB-SNe are shown using the V band, while other SNe Ic-BL, including SN 2026gzf, are shown using the r band. The data have been taken from (Z. Cano 2013; Z. Cano et al. 2014, 2017a; F. Taddia et al. 2018; G. P. Srinivasaragavan et al. 2024, 2025b; J. C. Rastinejad et al. 2025; L. Cotter et al. 2026).
Other Images in This Article
Show More
Copyright and Terms & Conditions
© 2026. The Author(s). Published by the American Astronomical Society.

