

Image Details
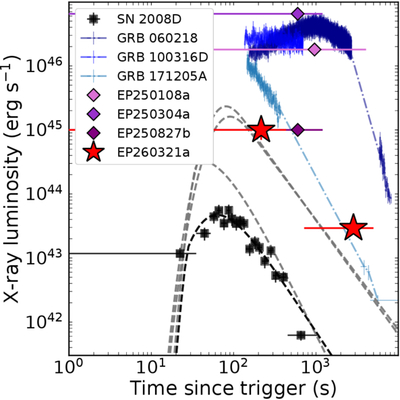
Caption: Figure 14.
X-ray lightcurves of shock breakout candidates detected by Swift and EP. The EP events are based on time-averaged spectra, and the initial data point for each event is in the 0.5–4 keV band, while all other points (and all Swift events) are in the 0.3–10 keV band. However, the EP events display soft spectra and are unlikely to be very different in a broader energy band. Data have been taken from A. M. Soderberg et al. (2008), H. Sun et al. (2025), W. X. Li et al. (2025), G. P. Srinivasaragavan et al. (2025b), and W. Yuan et al. (2026). Dashed lines represent a compilation of SN Ib and SN Ic-BL shock breakout models from C. L. Fryer et al. (2026). We note that the delay in the start of the GRB lightcurves is due to the slew time of Swift following the gamma-ray triggers.
Other Images in This Article
Show More
Copyright and Terms & Conditions
© 2026. The Author(s). Published by the American Astronomical Society.

