

Image Details
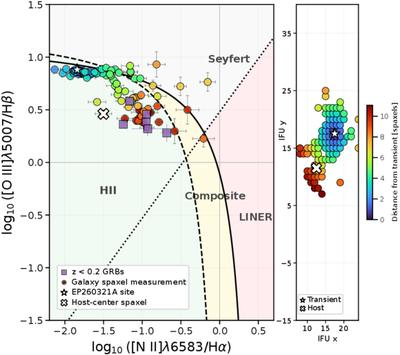
Caption: Figure 11.
Spatially resolved [N II] BPT diagram from HET-IFU spectroscopy. Each point represents an individual galaxy spaxel, with emission-line ratios following the BPT diagnostics of J. A. Baldwin et al. (1981). Points are color-coded by projected distance from the transient position, as shown in the IFU field map on the right with units of the spaxel (0﹩\mathop{.}\limits^{{\unicode{x02033}}}﹩4 × 0﹩\mathop{.}\limits^{{\unicode{x02033}}}﹩4) grid. The dashed, solid, and dotted curves indicate the G. Kauffmann et al. (2003) star-forming/composite boundary, the L. J. Kewley et al. (2001) maximum starburst boundary, and the L. J. Kewley et al. (2006) Seyfert/LINER division, respectively. The shaded regions show the corresponding H II-like region, composite, Seyfert, and LINER-like classifications. The transient site is marked by a white star, while the location of the galaxy center is shown with a white cross. GRB explosion site measurements at z < 0.2 are shown as purple squares (L. Christensen et al. 2008; X. H. Han et al. 2010; E. M. Levesque et al. 2011, 2012; C. C. Thöne et al. 2014, 2024; L. Izzo et al. 2017).
Other Images in This Article
Show More
Copyright and Terms & Conditions
© 2026. The Author(s). Published by the American Astronomical Society.

