

Image Details
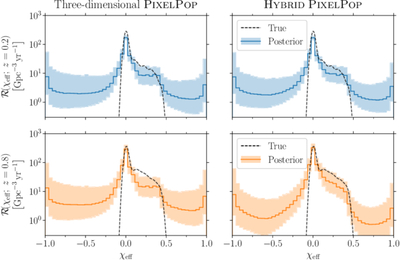
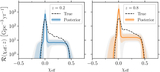
Caption: Figure 6.
Inferred merger-rate density ﹩{ \mathcal R }({\chi }_{{\rm{eff}}};z)﹩ evaluated at redshifts z = 0.2 (blue) and z = 0.8 (orange) for three-dimensional PIXELPOP (left) and the HYBRID model (right), defined in Equations (6) and (7), respectively. The dashed line shows the true population, while the solid line and shaded region represent the posterior median and central 90% credible region.
Other Images in This Article
Show More
Copyright and Terms & Conditions
© 2026. The Author(s). Published by the American Astronomical Society.

Copyright ©
2026 Astronomy Image Explorer. All Rights Reserved.
