

Image Details
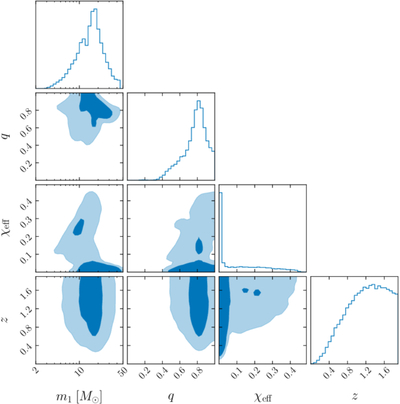
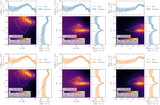
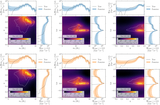
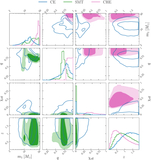
Caption: Figure 1.
One- and two-dimensional marginals of the source-frame primary mass m1, mass ratio q, effective spin χeff, and redshift z of the simulated CE population. The contours show the 50% and 90% credible regions.
Other Images in This Article
Show More
Copyright and Terms & Conditions
© 2026. The Author(s). Published by the American Astronomical Society.

Copyright ©
2026 Astronomy Image Explorer. All Rights Reserved.
