

Image Details
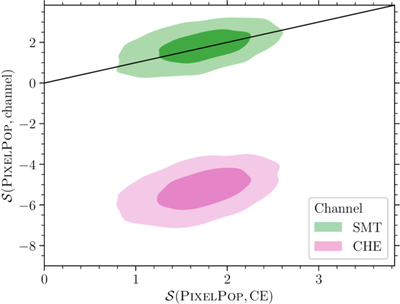
Caption: Figure 10.
Similarity of the simulated SMT (green) and CHE (pink) populations to the HYBRID model (vertical axis), compared to that of the true CE population (horizontal axis). Contours show the 50% and 90% credible regions over the similarities computed using posterior samples for the HYBRID population model. In regions below the diagonal line, the CE population is correctly concluded to be the true population.
Other Images in This Article
Show More
Copyright and Terms & Conditions
© 2026. The Author(s). Published by the American Astronomical Society.

Copyright ©
2026 Astronomy Image Explorer. All Rights Reserved.
