

Image Details
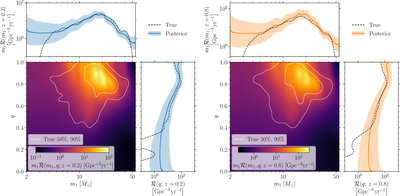
Caption: Figure 3.
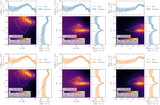
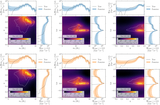
Left: comoving merger-rate density ﹩{ \mathcal R }({m}_{1},q;z)﹩ inferred by PIXELPOP, evaluated at a fixed redshift z = 0.2. The central panel shows the median of the two-dimensional merger-rate density, along with 50% and 90% credibility regions of the true population. Brighter regions indicate a higher merger rate. The upper and right-hand panels show the marginal merger-rate density ﹩{ \mathcal R }({m}_{1};z=0.2)﹩ and ﹩{ \mathcal R }(q;z=0.2)﹩, respectively. The solid blue line shows the posterior median, with the central 90% credible region shaded. The dashed lines show the true underlying population, calculated using a kernel density estimate (KDE) scaled by the overall merger rate implied by the number of detections during the observing time. Right: same as the left-hand panel, except at z = 0.8.
Other Images in This Article
Show More
Copyright and Terms & Conditions
© 2026. The Author(s). Published by the American Astronomical Society.

