

Image Details
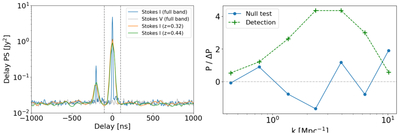
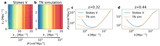
Caption: Figure 20.
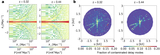
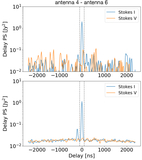
Evidence of broadband systematics and null test. Left: delay power spectra for the same antenna pair and scan as in Figure 9. The Stokes I spectra are shown separately for the two analysis bands, z = 0.32 and z = 0.44, and for the full accessible frequency range 952–1170 MHz (labeled as “full band”). The Stokes V full-band spectrum is shown as a noise reference. The vertical dashed lines mark ∣τ∣ = 100 ns, enclosing the foreground-dominated delay region. The excess features appear at the same physical delays in the two individual spectral windows and in the full-band transform, demonstrating that the systematic is broadband and coherent across the analysis bands. Right: the ratio of the estimated cross-power (odd × even) to its corresponding 1σ error is shown for two different cases. The “Detection” case corresponds to the results presented in this Letter using UVDF, where P/ΔP is averaged over z = 0.32 and z = 0.44. The “null test” case represents the average cross-power-to-error ratio where the odd and even scans belong to different z-bins. The k-values are computed at 1078 MHz. The absence of signal in the “null test” (right), despite the broadband nature of the contaminant (left), confirms that our flagging strategy successfully isolates and removes these systematics from the final measurement.
Other Images in This Article
Show More
Copyright and Terms & Conditions
© 2026. The Author(s). Published by the American Astronomical Society.

