

Image Details
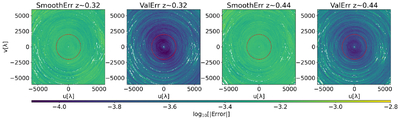
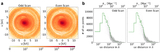
Caption: Figure 15.
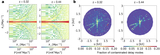
The gridded estimated bandpass error of the observation. The absolute values of the errors are taken and averaged across the frequency channels for visualization. Errors are estimated with two methods: “ValErr” and “SmoothErr” (discussed in Section 2.2). The left panels show the results for the z = 0.32 bin, and the right panels show the results for z = 0.44. The red circles correspond to the ∣u∣ < 2000λ region, where the visibilites are used for the power spectrum estimation.
Other Images in This Article
Show More
Copyright and Terms & Conditions
© 2026. The Author(s). Published by the American Astronomical Society.

Copyright ©
2026 Astronomy Image Explorer. All Rights Reserved.
