

Image Details
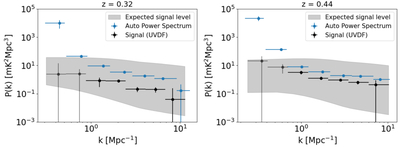
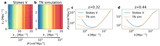
Caption: Figure 14.
Expected signal levels at z = 0.32 and z = 0.44. The measurement with UVDF is denoted as “Signal,” and the expected level of signal is calculated following Appendix G. The first two k-bins, while demonstrating a detection, are believed to be less robust to systematics than the rest of the k-bins and, therefore, are denoted differently. The detection significance quoted in this work excludes the first two k-bins. The 1D autopower spectrum in these plots is derived from the complete dataset, with any baselines identified as contaminated by the BLF method excluded from the estimation and the noise bias subtracted. This autopower should be considered as an upper limit since it contains systematics that are further reduced in the cross-correlation.
Other Images in This Article
Show More
Copyright and Terms & Conditions
© 2026. The Author(s). Published by the American Astronomical Society.

