

Image Details
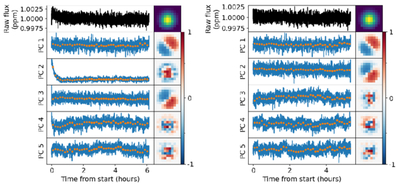
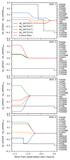
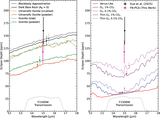
Caption: Figure 11.
The frame-normalized principal component eigenvalues (left column) and eigenimages (right column) compared to the raw light curve and point-spread function (top row) for visit 2 when not trimming any data (left panel) and when trimming the first 500 integrations (right panel). The components found after trimming the first 500 integrations are used in our light-curve fitting.
Other Images in This Article
Show More
Copyright and Terms & Conditions
© 2026. The Author(s). Published by the American Astronomical Society.

Copyright ©
2026 Astronomy Image Explorer. All Rights Reserved.
