

Image Details
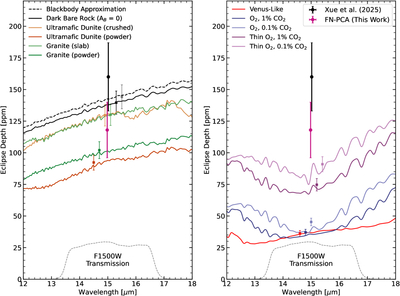
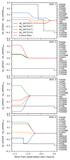
Caption: Figure 8.
Simulated emission spectra of GJ 3929 b for various surface (left) and atmospheric (right) compositions compared to the measured eclipse depths from our FN-PCA calculation, alongside the previously reported result using only the first two visits by Q. Xue et al. (2025). The F1500W filter transmission is shown with the dotted line at the bottom. The simulated MIRI 1500W eclipse depths for each of the models are shown as squares in each panel, with error bars indicating the estimated model uncertainty (Section 4.4; C. Monaghan et al. 2026). Small horizontal offsets between points are added for clarity. The ultramafic dunite, granite, and basalt model spectra were generated using the dunite xenolith, dalmatian granite, and K1919 basalt spectral data from K. Paragas et al. (2025). The thin-atmosphere models were generated assuming zero heat redistribution to the nightside, and the thick-atmosphere models assume full heat redistribution. Additional models and σ confidences are reported in Table 4.
Other Images in This Article
Show More
Copyright and Terms & Conditions
© 2026. The Author(s). Published by the American Astronomical Society.

