

Image Details
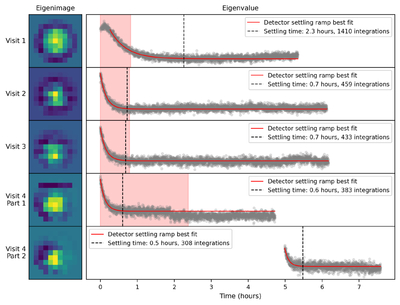
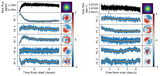
Caption: Figure 2.
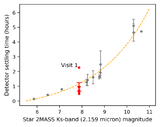
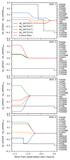
Detector-settling principal component eigenimages (left) and eigenvalues (right) for all visits of GJ 3929 b. The shaded region shows the range trimmed from the start of each observation. The first component features a lip that is not seen in the other observations and is not included in the exponential ramp fitting. The first visit component also shows an upward linear trend throughout the eigenvalue. The first observation of visit 4 has a sudden drop near the 2 hr mark, possibly marking a tilt event. The average settling times in hours are plotted against the Ks-band magnitude of the star in Figure 5.
Other Images in This Article
Show More
Copyright and Terms & Conditions
© 2026. The Author(s). Published by the American Astronomical Society.

