

Image Details
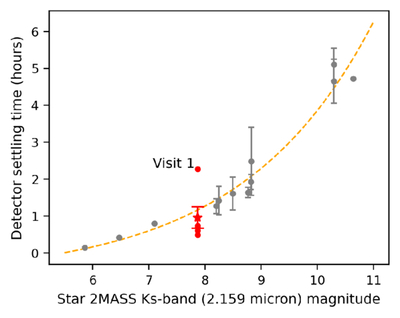
Caption: Figure 5.
Detector-settling time from the five observations of GJ 3929 b in red (visit 4 is split into two). These values are found by fitting their detector-settling PCs with an exponential ramp and taking the time for 99% of the signal to decay, giving 2.3, 0.7, 0.7, 0.6, and 0.5 hr for the five observations, respectively. The average settling time across all observations of GJ 3929 b is plotted as the red star, plotted with the standard error. Visit 1 is labeled, due to its notably high settling time. The dotted orange line is the detector-settling trend found in N. J. Connors et al. (2025): ﹩{T}_{\mathrm{settling}}=0.063{e}^{0.427{m}_{{K}_{s}}}-0.657﹩ hr.
Other Images in This Article
Show More
Copyright and Terms & Conditions
© 2026. The Author(s). Published by the American Astronomical Society.

