

Image Details
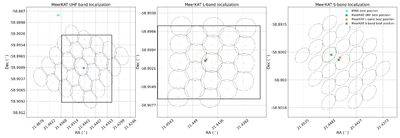
Caption: Figure 6.
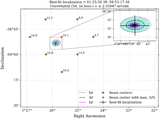
The localization plots obtained from SeeKAT on the three MeerKAT observations. The left plot is the localization position obtained from the UHF-band observation. The middle plot is the localization position obtained from the L-band observation. The right plot is the localization position obtained from the S1-band observation. The grids on each plot are drawn at intervals of 10″. The boxes in the first two plots are the zoomed-in regions for the subsequent localization at higher frequency.
Other Images in This Article
Show More
Copyright and Terms & Conditions
© 2026. The Author(s). Published by the American Astronomical Society.

Copyright ©
2026 Astronomy Image Explorer. All Rights Reserved.
