

Image Details
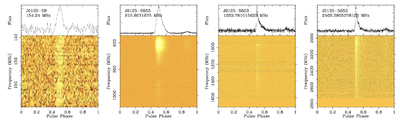
Caption: Figure 3.
Detection plots of PSR J0125−5854 across the frequency range spanning from ∼150 MHz to 2.8 GHz. From left to right, the MWA discovery observation (140–170 MHz) and MeerKAT detections in the UHF, L, and S1 bands. The upper panels show the integrated profiles, and the lower panels show the time-averaged signal in pulse phase versus frequency. The integration times are 80 minutes for the MWA band, 60 minutes for UHF, and 30 minutes each for the L and S1 bands. An interpulse emission is clearly visible in the MeerKAT detections; the UHF detection is notable for an exceedingly bright scintle in the lower segment of the band.
Other Images in This Article
Show More
Copyright and Terms & Conditions
© 2026. The Author(s). Published by the American Astronomical Society.

