

Image Details
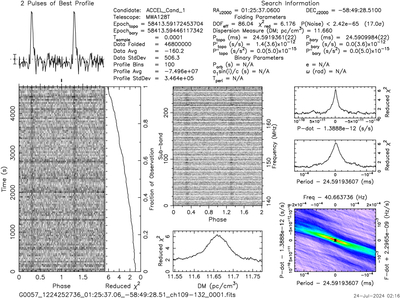
Caption: Figure 1.
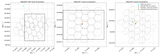
PRESTO detection plot of PSR J0125−5854 from the discovery observation: the top left panel shows the integrated (time-averaged) pulse profile; the bottom left panel displays the signal strength versus pulse phase and time; the middle panel shows the signal strength versus pulse phase and frequency; and the remainder plots are various diagnostic plots from the search pipeline, showing the best period and DM.
Other Images in This Article
Show More
Copyright and Terms & Conditions
© 2026. The Author(s). Published by the American Astronomical Society.

Copyright ©
2026 Astronomy Image Explorer. All Rights Reserved.
