

Image Details
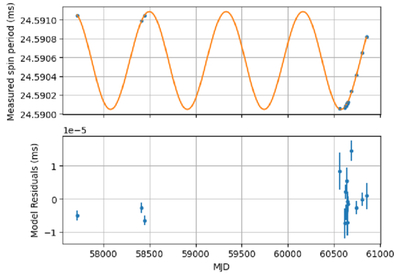
Caption: Figure 7.
Top: the solid line shows the variation of the spin period expected from the best-fit orbital model for the PSR J0125−5854 system, and the blue dots show the measured periods of the pulsar at all observation epochs. Bottom: the residuals in the measured spin periods compared to the expected values from the modeled orbit. The rms value and the reduced χ2 of the fit are 5 × 10⁻⁶ ms and 7.3, respectively.
Other Images in This Article
Show More
Copyright and Terms & Conditions
© 2026. The Author(s). Published by the American Astronomical Society.

Copyright ©
2026 Astronomy Image Explorer. All Rights Reserved.
