Image Details
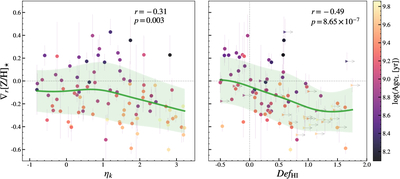
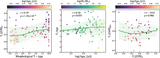
Caption: Figure 5.
Environmental dependence of metallicity gradients (∇r[Z/H]). Left: metallicity gradients as a function of the local projected density (ηk). Right: metallicity gradients as a function of the H I deficiency (DefHI). All galaxies are color-coded by their light-weighted stellar age (﹩\mathrm{log}{\rm{Age}}[{\rm{yr}}]﹩). In the right panel, right-pointing triangles with arrows represent galaxies with H I upper limits (lower limits for DefHI). In each panel, the solid green line and the surrounding shaded band represent the overall trend and its uncertainty, derived from a Gaussian running median. The Spearman correlation coefficient (r) and the p-value are displayed in each panel. Gray dashed horizontal and vertical lines mark the zero-point for each parameter.
Other Images in This Article
Copyright and Terms & Conditions
© 2026. The Author(s). Published by the American Astronomical Society.