Image Details
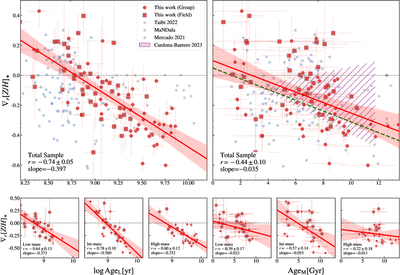
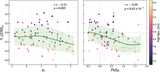
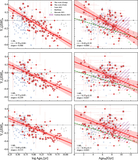
Caption: Figure 2.
Correlation between metallicity gradients (∇r[Z/H]) and average stellar ages. The top row shows the total sample for light-weighted ages (﹩\mathrm{log}{{\rm{Age}}}_{{\rm{L}}}[{\rm{yr}}]﹩, left) and mass-weighted ages (AgeM[Gyr], right). Circles and squares represent group and field galaxies, respectively. The solid red lines and shaded regions denote the best-fit linear relations and their 1σ uncertainties. For comparison, we overplot Local Group dwarfs from S. Taibi et al. (2022) (gray circles; using t90 and t50 as proxies for AgeL and AgeM, respectively), the MaNDala sample (M. Cano-Díaz et al. 2025) (blue circles), and simulation results from F. J. Mercado et al. (2021) (green dashed line in the mass-weighted panel) and S. Cardona-Barrero et al. (2023) (purple hatched region in the mass-weighted panel). The bottom panels show the same correlations subdivided into three stellar mass bins (low-, intermediate-, and high-mass, as defined in the text). Pearson correlation coefficients (r) and best-fit slopes are indicated in each panel. The horizontal dashed lines mark a flat gradient (∇r = 0). Note that AgeL is plotted in logarithmic scale while AgeM is plotted in linear scale (for a direct comparison with F. J. Mercado et al. 2021).
Other Images in This Article
Copyright and Terms & Conditions
© 2026. The Author(s). Published by the American Astronomical Society.