Image Details
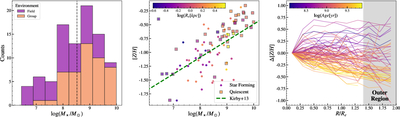
Caption: Figure 1.
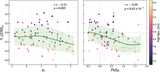
Global and structural properties of the galaxy sample. Left: distribution of stellar masses for field (purple) and group (orange) environments. The sample covers a mass range of 106.5–1010 M⊙. The vertical dashed line marks the median stellar mass of the entire sample (﹩\mathrm{log}({M}_{\star }/{M}_{\odot })\approx 8.5﹩). Middle: stellar mass–metallicity relation (MZR), where each point is color-coded by the effective radius. Circular and square symbols represent star-forming and quiescent galaxies, respectively. The green dashed line represents the Local Group dwarf galaxy relation from E. N. Kirby et al. (2013). Right: radial profiles of residual light-weighted metallicity (Δ[Z/H]) as a function of Re-normalized major-axis radius. Lines are color-coded by the light-weighted stellar age of the galaxy. The shaded gray region indicates the outer parts of the galaxies (R > 1.4 Re). A clear trend is visible where older galaxies (orange/yellow) exhibit steeper negative gradients compared to the flatter or slightly positive profiles of younger systems (purple).
Other Images in This Article
Copyright and Terms & Conditions
© 2026. The Author(s). Published by the American Astronomical Society.