Image Details
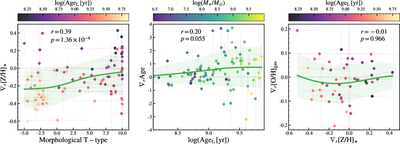
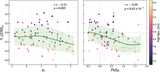
Caption: Figure 4.
Stellar population and gas-phase metallicity gradients across different galaxy scaling relations. Left: stellar metallicity gradients (∇r[Z/H]⋆) as a function of morphological T type. Data points are color-coded by light-weighted stellar age (﹩\mathrm{log}({{\rm{Age}}}_{{\rm{L}}}/{\rm{yr}})﹩). Middle: stellar age gradients (∇rAge) as a function of light-weighted stellar age. Data points are color-coded by stellar mass (﹩\mathrm{log}({M}_{\star }/{M}_{\odot })﹩). Right: comparison between gas-phase metallicity gradients (∇r[O/H]gas) and stellar metallicity gradients (∇r[Z/H]⋆). Data points are color-coded by light-weighted stellar age (﹩\mathrm{log}({{\rm{Age}}}_{{\rm{L}}}/{\rm{yr}})﹩). In each panel, the solid green line and its surrounding shaded region denote the global trend and the associated uncertainty, determined via a running median with a Gaussian kernel. The Spearman correlation coefficient (r) and the associated p-value are displayed in each panel. The horizontal and vertical lines mark a flat gradient. For more details, see Section 5.1 for the left panel and Section 5.2 for the middle and right panels.
Other Images in This Article
Copyright and Terms & Conditions
© 2026. The Author(s). Published by the American Astronomical Society.