Image Details
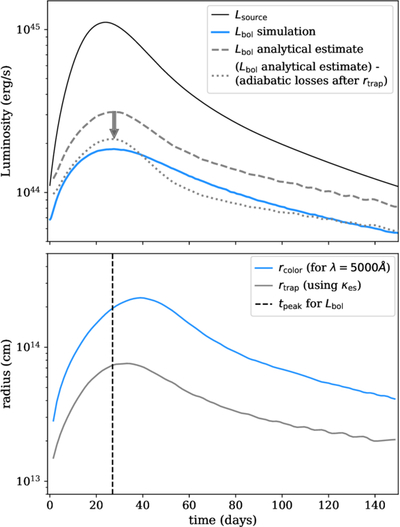
Caption: Figure 5.
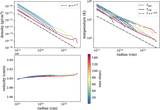
Top: we find that adiabatic losses result in a peak luminosity that is ∼6× lower than the input luminosity (Lsource). Analytic predictions based on the evolving density profile in the simulations and Lsource predict a higher luminosity (smaller adiabatic losses, dashed line). However, these predictions assume that all adiabatic losses occur interior to rtrap (that all luminosity interior to Rtrap is advected, and all luminosity outside rtrap diffuses). In reality, this transition is more gradual. If we subtract the adiabatic losses from outside the trapping radius (from the simulation) from the analytical prediction of the luminosity (dotted line), we find that it is much closer to the simulation output luminosity. Bottom: the trapping radius and (optical) color radius, compared to the time of the peak optical luminosity. The color radius (rcolor) is wavelength dependent, so here we set κabs(t) = κabs(t) at λ = 5000 Å as we are interested in the reprocessing of optical emission. The optical color radius continues to grow after the bolometric luminosity peaks, similar to what we see from the optical luminosity.
Other Images in This Article
Copyright and Terms & Conditions
© 2026. The Author(s). Published by the American Astronomical Society.