Image Details
Caption: Figure 2.
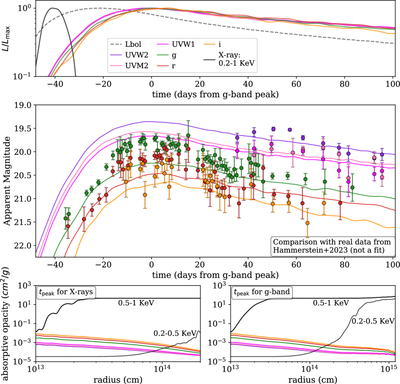
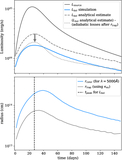
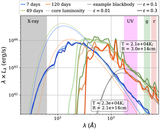
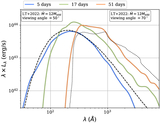
We simulate the rise, peak, and initial decay of a TDE using MCRT + 1D hydrodynamics. Top plot: we plot the intrinsic optical/UV evolution, scaled to the peak luminosity in each band (We use UV bands from Swift and optical bands from Palomar/ZTF. Our X-ray bands have a flat throughput = 1 over the relevant energy ranges.) We find that higher energy bands peak earlier, and UV/optical emission peaks weeks after the bolometric luminosity. X-rays peak before the bolometric luminosity, then get absorbed by the growing outflow, which in turn produces the UV and optical emission that peaks later. Note that this is a 1D calculation, and therefore, including viewing angles with lower optical depths would likely lead to different behavior of the X-ray emission in particular. Middle plot: we compare our optical through UV evolution to a real TDE (AT2020ocn) with a similar black hole mass (4 × 10⁶M⊙ from the M–σ relation) and UV/optical blackbody parameters. We plot the apparent magnitude of our simulations at z = 0.07 (time is in the observer frame) and assume a Milky Way hydrogen column density nh,mw = 1020cm−2 (from E. F. Schlafly & D. P. Finkbeiner 2011) to compare with the light curve of AT2020ocn (from E. Hammerstein et al. 2023b). Bottom plots: we plot the weighted average of the absorptive opacity over the different bands (given the band transmission curves used in the top and middle plots) as a function of radius in the simulation. We split X-rays into harder and softer energy ranges. The left plot is at the X-ray peak (=7 days into the simulation), the right plot is at the g-band peak (=49 days). The opacity to X-rays between 0.2 and 0.5 keV increases dramatically at the outer edge of the simulation, where gas is cooler, and oxygen is in lower ionization states. By the g-band peak, the opacity to all X-ray photons is orders of magnitude higher than the opacity to UV/optical photons.
Other Images in This Article
Copyright and Terms & Conditions
© 2026. The Author(s). Published by the American Astronomical Society.