Image Details
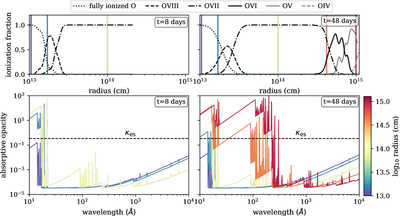
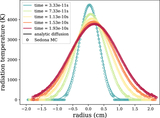
Caption: Figure 4.
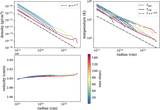
Top: fraction of oxygen in different ionization states as a function of radius at two representative times in the light curve. Opacities at radii denoted by rainbow vertical lines are plotted in the bottom plots. Bottom: opacity due to bound-free, free–free, and bound-bound transitions at various radii throughout outflows plotted at the same times as ionization states in top plots. Prominent ionization edges at 17, 90, and 108 Å correspond to the ionization of O VII, O VI, and O V, respectively. The ionization edge between 226 and 228 Å is due to the ionization of both O IV and He II. The ionization edge at 910 Å is from H I and O I. The upward slope of the opacity redward of 1000 Å comes from free–free emission. Near the peak of the optical/UV light curve, the increased fraction of oxygen in lower ionization states at large radii (orange and red lines in the right plots) results in the X-ray emission getting absorbed.
Other Images in This Article
Copyright and Terms & Conditions
© 2026. The Author(s). Published by the American Astronomical Society.