Image Details
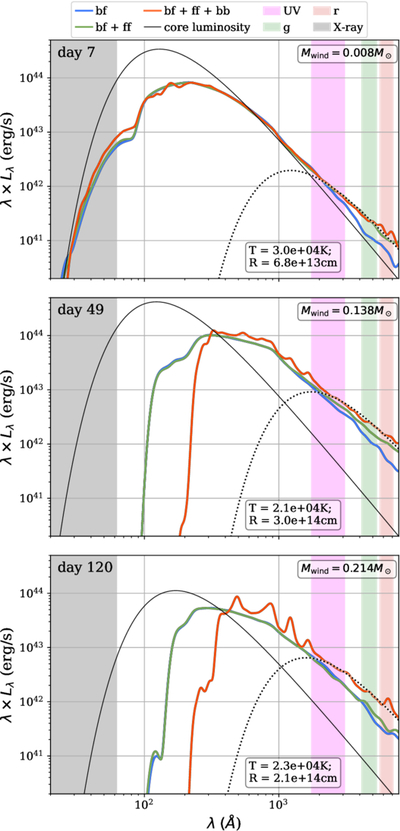
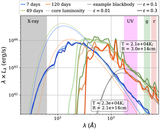
Caption: Figure 3.
The blue, green, and orange lines show the output SED using three different opacity prescriptions—bound-free (blue), bound-free + free–free (green), and bound-free + free–free + bound-bound (orange). All three also include electron scattering opacities. The top plot shows emission early on the rise at 7 days into the simulation, the middle plot shows emission at 49 days (near the optical/UV peak), and the bottom plot shows emission at 120 days, on the decline. The thin black solid lines show the source luminosity at these times, and the dotted black lines show example blackbody SEDs that match the emission relatively well in observable UV and optical bands, emphasizing the likelihood of underestimating the true luminosity when fitting blackbodies to observations. The shaded black, magenta, green, and red vertical regions represented the approximated band range of eRosita, Swift UV, and Palomar g and r bands.
Other Images in This Article
Copyright and Terms & Conditions
© 2026. The Author(s). Published by the American Astronomical Society.