

Image Details
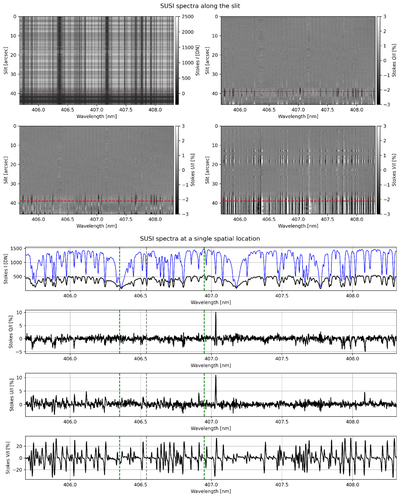
Caption: Figure 4.
Cuts through the nonrestored SUSI observation presented in Figure 3. The top four images show the Stokes spectrograms along the slit (see the blue line in Figure 3). The gray scale has been chosen to reveal the many weaker signals present in the data. The red dashed lines mark the spatial location (see also the red cross in Figure 3) corresponding to the bottom four spectra shown in black. The blue spectrum shown in Stokes I corresponds to the average along the full slit. The green dashed lines mark the wavelength positions of the raster scans shown in Figure 3. The gray dashed line marks the Fe I absorption line at 406.538 nm, which has zero effective Landé g factor. The spectral line with the strongest Q/I signal is Mn I 407.028 nm. Residual instrumental effects may still be present at this stage of the data reduction.
Other Images in This Article

Copyright and Terms & Conditions
© 2026. The Author(s). Published by the American Astronomical Society.

