

Image Details
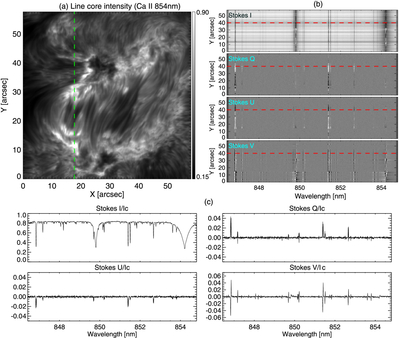
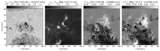
Caption: Figure 2.
Example of SCIP data: (a) Ca II 854 nm line-core intensity map of the emerging AR observed on 2024 July 15 (see SUNRISE ID 30_EMEF in Table 1). (b) Stokes I, Q, U, and V data along the slit indicated by the green dashed line in panel (a). (c) Stokes profiles along the red dashed line in panel (b) normalized by the continuum intensity averaged over the quiet area in the image. The integration time of this dataset is 1 s at each slit position.
Other Images in This Article
Copyright and Terms & Conditions
© 2026. The Author(s). Published by the American Astronomical Society.

Copyright ©
2026 Astronomy Image Explorer. All Rights Reserved.
